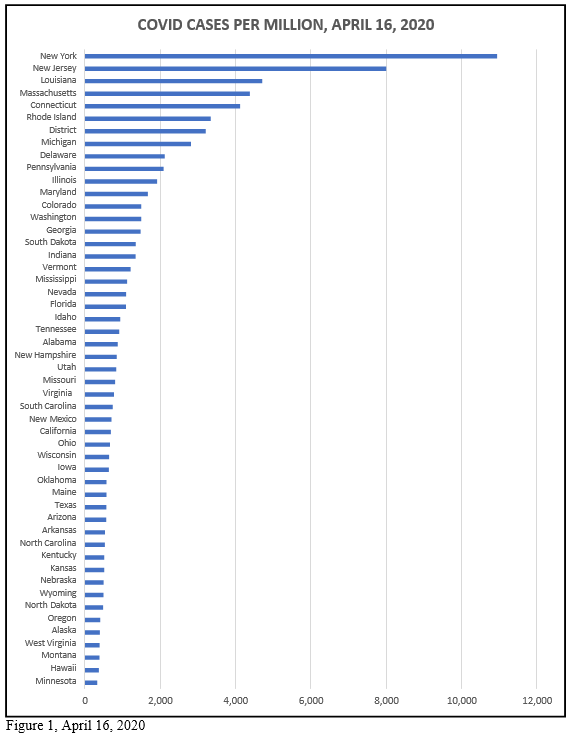
It has been two weeks since we looked at the trajectory of COVID-19. Here are a few new indicators. Figure 1 shows the number of cases per million residents, by state. Our neighbors in Minnesota are enjoying their “geographic distancing” from Chicago. But there is something else at work. Perhaps it is Scandinavian abstinence.
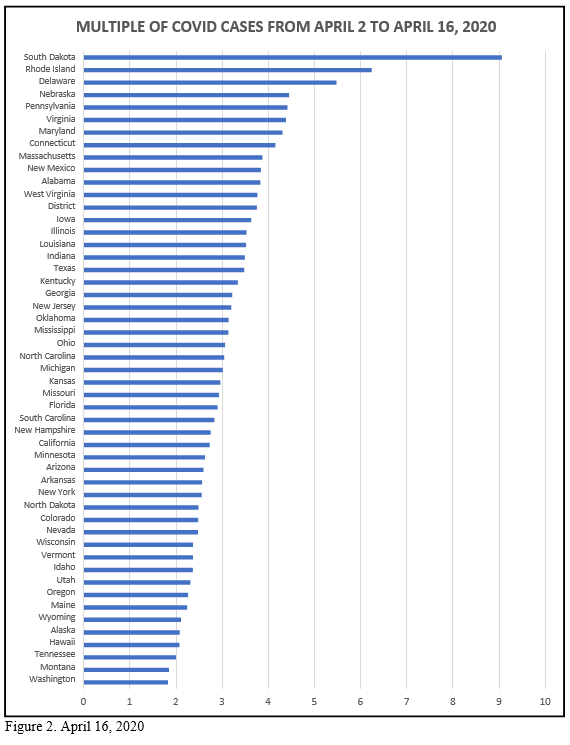
Figure 2 shows the change in the number of cases since April 2. Rhode Island and Delaware are understandable—proximity to New York and New Jersey. But remote and de-populated South Dakota? We now know that the governor of that lovely land figured she knew better than the medical experts and fake media. As we say where I grew up out west, “If you f…with the bull you get the horn.” Someone from South Dakota ought to understand a little cowboy wisdom. But partisanship still reigns.
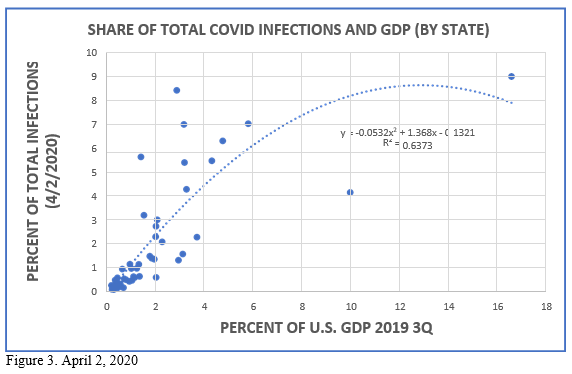
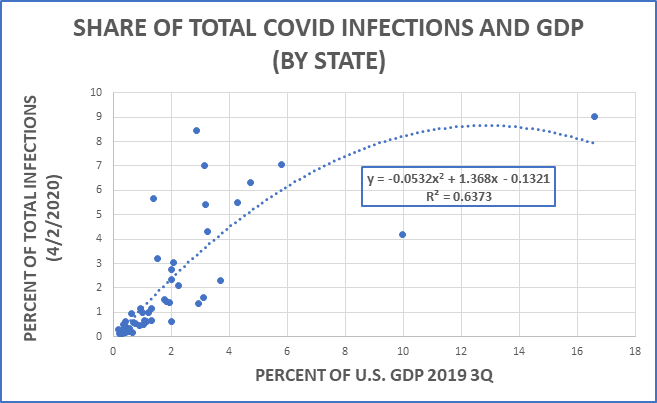
Now I revisit a graph I sent on April 2, 2016 relating the share of total cases with the share of GDP (3rd quarter of 2019). Recall that this excludes New York and New Jersey—obvious outliers. The two extremes are California (top right) and Texas (below the curve in the middle).
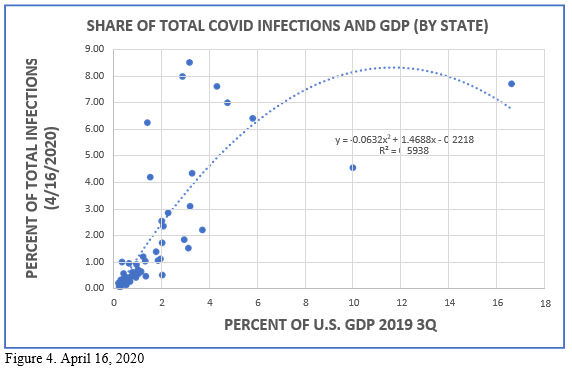
And here are the same data for April 16, 2020. Notice that my little model now accounts for a slightly smaller share of the variation in cases in relation to share of GDP (R2=0.5938 versus 0.6373). This is expected as the virus spreads out away from the origins (economic and travel nodes). As the situation evolves other factors are assuming greater salience—elderly populations, general health conditions, absence of strict social distancing (South Dakota).
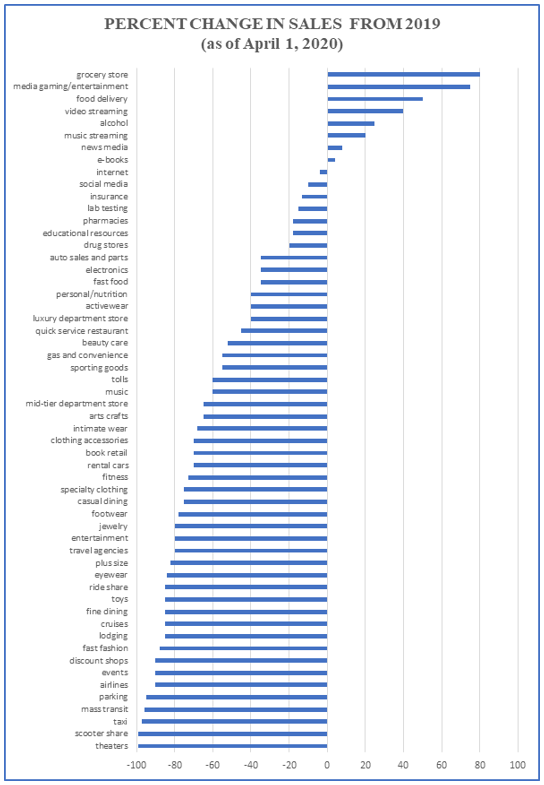
Here is a compilation of credit card expenditures covering the three-month period January 1 – April 1, 2019 with the same period in 2020. We can see where the hurt is (and isn’t). Negative is to the left.
Some of the categories do not map directly into specific places of business—this is how credit card companies classify spending. We can see how spending has contracted into a few “essential” categories. One can also predict which expenditure categories may face the most difficult recovery.
A recession is two consecutive quarters in which GDP falls. We are certainly headed for a recession. Some estimates are that GDP will not recover to its January 2020 level for a year or more. Will we have a depression? Unlikely. Words matter—and in economics, words are concepts. And as a famous philosopher reminds us, “Grasping a concept is mastering the use of a word.”
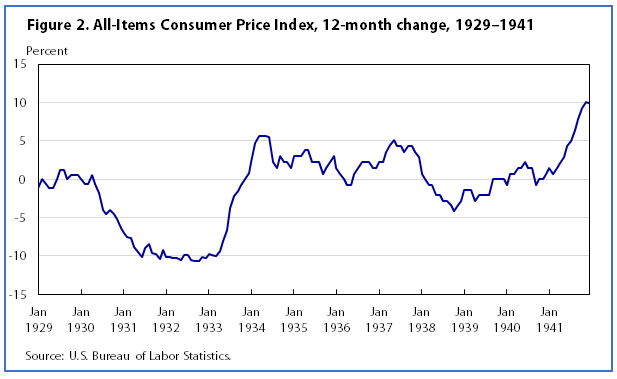
The term “depression” comes from a period in which prices are depressed—the general price level is falling or has fallen. Here is a picture of consumer prices from January 1929. Prices did not fully recover until World War II. But you cannot have a depression without depressed (falling) prices.
Are we facing a period of falling prices? Except for gasoline prices—the result of a Saudi- Russian game—few prices will be falling.
Ironically, the closure of so many businesses rules out falling prices. After all, prices fall when merchants have too many goods on hand and they wish to sell those goods to a population with too little income but an enduring demand for goods and services. Prices are reduced to encourage buying.
Unfortunately, once prices start to drop in this way, consumers hold off—expecting that prices might actually fall a little more tomorrow. This cycle continues as consumers delay, merchants panic, prices are reduced (sales, special offers,), etc. etc. Necessities are purchased, but many other purchases are delayed. Falling sales and revenues to merchants then induce them to reduce staffing, causing unemployment and further reducing aggregate income—and further feeding price cuts to encourage consumption. The economy falls into an under-consumption trap. Japan spent a decade or more in such a place during the 1990s and even into the recent past. It was a period of stagnation.
But the stay-at-home nature of this crisis has squashed demand for everything but bare subsistence—including toilet paper. Just think how much toilet paper is now sitting in the storage closets and back rooms of schools, restaurants, factories, movie theaters, and retail stores throughout the land. On the last day of work, the owners/managers of these shuttered places would have done all of us a big favor by sending each furloughed/dismissed employee home with a large bundle of toilet paper. But I digress.
To understand why we will not encounter a Depression, let me point out how very different this time is from the 1930s.
The period following World War I was one of exuberance and excess. Rural out-migration, fueled by technical change in agriculture spurred industrialization and optimism. The sense was that the stock market would go on rising forever. Sound familiar?
Agricultural production was robust leading to a drop in farm prices—creating rural despair.
In March of 1929 the Federal Reserve expressed alarm of excessive speculation in the stock market. Jitters produced some selling. Steel production started to decline as war-time levels of output began to fall. Construction slowed down a little, and car sales began to fall, furthering the decline in demand for steel (that is before cars were made of plastic).
But bank credit was easy and consumer debt seemed to be edging up. The stock market had been on a nine-year run that saw the Dow Jones Industrial Average increase in value tenfold. Sound familiar yet? There was a small correction in late September. The London Stock Exchange fell somewhat in September—and there was fraud involved. On October 24—so-called “Black Thursday”—the U.S. Stock market lost 11 percent of its value at the opening bell on very heavy trading.
This shock fueled fear of running out of cash and so many people rushed to their bank to withdraw funds. Recall, that was a cash economy—there were no credit cards. Most families held all of their liquidity in banks (or under the mattress). Some big-ticket merchandise was purchased on “lay-away.” The second phase, was therefore, a “run on banks” to get cash. By 1933, over 10,000 banks (almost one-half of the total) had failed. The supply of money had fallen by over 30 percent.
The third phase was evident—as purchases fell off, prices fell, and banks failed, many businesses were cut off from usual sources of credit. Unemployment grew. By 1933, almost forty percent of non-farm workers had lost their job. Farms and other businesses fell into bankruptcy. The recovery was sporadic and uncertain.
The fourth phase introduced something that is now familiar—a natural disaster. Widespread drought struck the major agricultural region of the country (the Midwest) in 1934—crops failed, more farms fell into bankruptcy, and food lines emerged. We did not have the storage capacity of today and so grain reserves were minimal. There were no global food chains bringing tomatoes, bananas, citrus, fish, and other exotics to the household. People ate meat and potatoes (recall dinner when you were growing up?).
The drought continued until 1940. The Dust Bowl further destroyed agriculture in the Midwest. Vast migration to California ensued. But economic conditions there were not much better. Even in those days, approximately 12-14 percent of the population lived on farms so they had access to some food. Even the non-farm population was still linked to the farm of parents or grandparents. Today, less than 1 percent of the population is on farms.
The memory of the Depression is one of unemployment, bankruptcies, and food lines. We did not have the policy instruments available to push money out to distressed families facing unemployment. So the Works Progress Administration put people to work.
It is from that experience that government programs were created to alleviate a repeat. The Federal Deposit Insurance Corporation assures us that our bank deposits are safe. Many other policy instruments are now available. However, we are learning just how clunky and slow they can be. One of the perils of a federal system, with strong independent states, is that we have 50 different political entities groping their way through this mess. Given sharp political divides, it is no surprise that responses vary. Apparently, states are forced to bid against each other to obtain essential medical supplies and equipment. European countries look upon us in disbelief.
So, we will not have a Depression, but we will now enter, I predict, a long period of suppressed economic activity. The definition of essential and frivolous consumption is up for debate.
Ostentation seems sure to go out of fashion. As I said earlier, Grey Eyed Athena is apparently repulsed by many of our lifestyle habits and choices.
I believe we might be entering a period defined as the “Great Suppression.” How does that sound?
This morning’s New York Times contains an article by Alan Yuhas entitled “Don’t Expect a Quarantine Baby Boom.” Recall an early “Fearless Prediction” of mine to that effect. This phenomenon requires a little more elaboration. And that relates to the nature of the so-called “recovery.”
There is speculation whether the “recovery” from the current situation will look like a “V” or a “U” or even the Nike “swoosh” for a little extra pizazz. All of this alphabet (and logo) talk pertains to GDP—the only metric that many people wish to consider. Sadly, this is to grab the “wrong end of the stick.” It is the wrong end because GDP is a complex mix of many variables that are themselves quite obscure—perhaps unknowable.
Among the considerations that must figure into all of this speculation, consider just a few: (1) the unknown changes in population over the near future; (2) the unknown impact on closures and bankruptcies of millions of businesses; (3) the unknown effect of changes in the labor force (the number of people working or actively looking for work); (4) the unknown labor force participation rate (the share of the work force actually working); (5) the unknown level of prices by which the total physical output of goods and services is actually valued for measurement as GDP; and (6) an unknown return wave of infections that will scramble all of the above.
It is better to start with the several components of a complex factor—only then can we meaningfully approach the aggregate of all of the disparate constituents. To gain traction on this problem, we must start with the realization that the U.S. has been experiencing, over the past decade or so, many symptoms of what I will call “late (or mature) capitalism.” What are these traits?
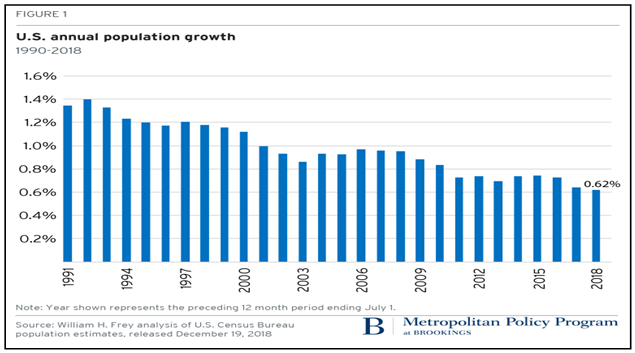
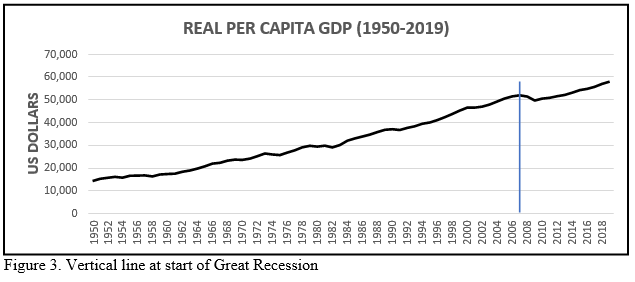
First, we want to look at the rate of population growth. Consider Figure 1.
Even before the Great Recession of 2007-2009, the annual rate of population growth had been on a profound decline. This is to be expected. All societies, as they become richer, show declining rates of population growth. This holds throughout the poorer countries of the world, and it happens in those that are already “rich.” In fact, if we take a historic look at this issue, high birth rates have been a practical social response to poor medical care (high infant mortality) and the lack of an old-age pension system beyond the family. In early times, there were good reasons to have many births since 60%-75% of infants would die. It was economically necessary to produce male offspring because of cultural practices in which girls married “out” of the household, while males stayed close and continued the family line (and business—usually farming).
With a drop in infant mortality, the need for redundant births disappeared. With the spread of organized (publicly funded) old-age protection, the private (family-based) burden of caring for parents gradually gave way. Two strong reasons for high fertility evaporated. Birth rates fell.
Childbirth was once the major cause of female mortality. Much family discord arises over raising children—it is difficult. With approximately 60% of women now in the workforce, and with husbands still resistant to sharing “housework”, families have more income but less patience with the demands of children. Parents increasingly wish to invest more in their children, so it is important to have fewer claimants on limited investment funds. So-called “helicoptering” of children is easier with fewer children to attend to. We see that smaller families are both the result of these changes in economic and social conditions, and the cause of such behaviors we observe. As societies become wealthier—ignoring for the moment the severe inequalities in America and a few other places—birth rates (family size) will fall.
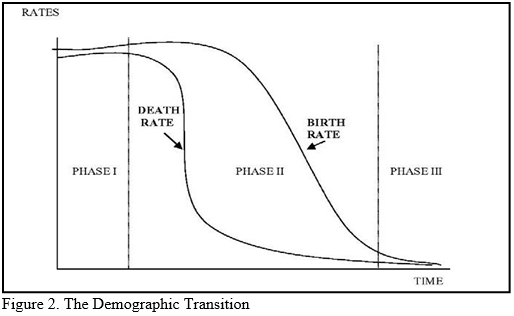
Richer countries also have improved health care, which drives down death rates. We get what is called the “demographic transition—moving from high birth and death rates, through falling deaths because of improved health care, but continuing high births rates from cultural inertia (see above) and finally falling birth rates. The developed world is firmly in Phase III with negative rates of population growth. (Figure 2).
Being a rich country is a symptom of “mature capitalism” –we have “arrived.” It is in the success of the system—making us richer—that we find the seeds of an eventual decline in its ability to do what we want from it. After all, with fewer births, there are fewer energetic youngsters to enter the work force and keep it vibrant and dynamic. The system’s success is the source of its gradual stagnation (Figure 3).
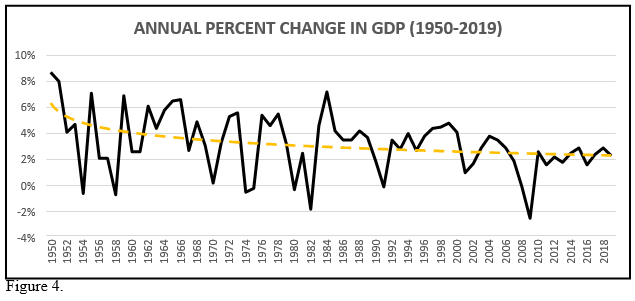
That is why we now see—in Figure 4—low rates of growth in GDP (when compared to the “go- go” post-war years of the 1960s and 1970s). In an analogue of our own human life cycle, aging is a plausible reason to slow down a little. A mature capitalist economy loses its vigor.
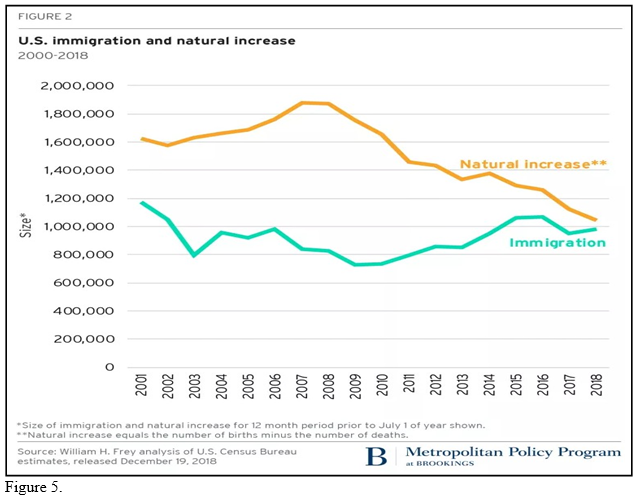
Much of the growth of the American economy throughout our history has been the arrival of immigrants. After all, since around 1600, virtually everyone who became an American had arrived in a ship or came north out of “new Spain.” In the period after World War II, immigrants continued to fuel our economic growth. They did the hard and dirty (and impecunious) work that others, newly rich, no longer wished to be bothered with. Immigrants will always drive economic growth—they are eager or they would not have come here, they are relatively poor and dislike their poverty, and they are willing to do most anything to put bread on the table.
In Figure 5 we see an ominous sign for the growth of the U.S. economy. Specifically, immigrants are not replacing the decline in indigenous (“natural”) births. With the current politically inspired hostility toward immigrants, we now face the worst of both worlds—declining “native” birth rates, and disappearing immigrants. Who will do the work?
Now to births. Recall I earlier predicted a quite dramatic drop in births following this health and economic crisis. Consider just such drop in both Figure 1 and Figure 5. Those earlier birth rates are not coming back.
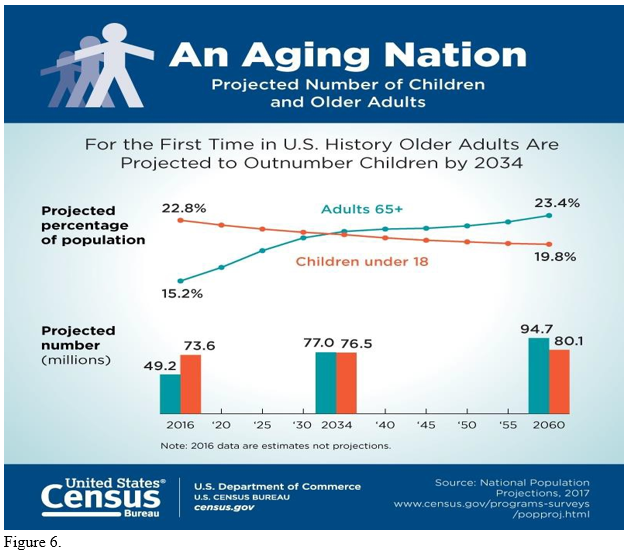
It is also well known that the American population is aging (Figure 6). Aside from the obvious implications for the labor force, there is the challenge of funding the Social Security (and health systems) with a declining share of the population actually working.
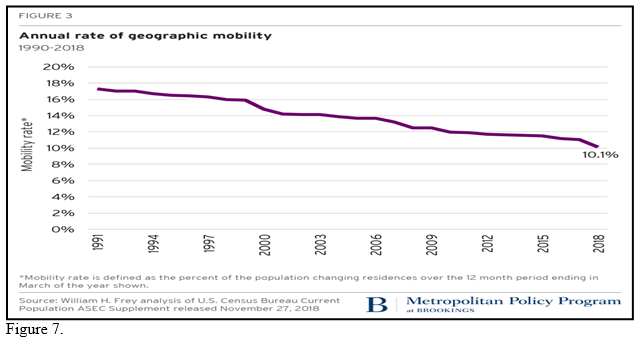
Finally, and returning to the nature of the active workforce, a maturing society and economy also shows signs of less mobility. It was once said that the typical American family moved every five years—and those moves were driven by job mobility, new opportunities, etc. But look at Figure 7. Since 1991, the rate of geographic mobility is now almost one-half of what it had been. There are fewer young people to move about, and older folks prefer to stay where they are. When companies close, or lay off employees, those who are somewhat settled, with a family, or who are close to retirement age, will remain in place. That too is a result of our relative wealth and comfort.
These demographic signs must be seen as playing a profound role in the post-COVID economy.
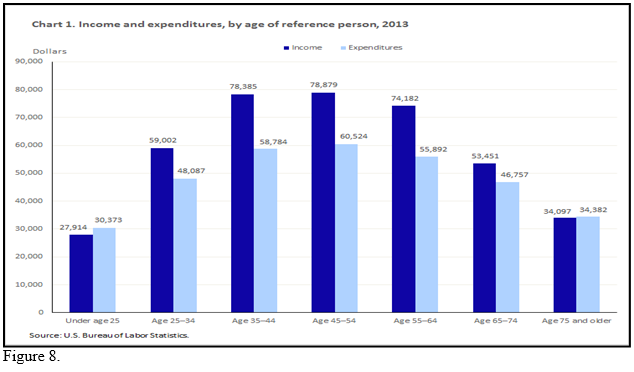
Consider spending by age group. In Figure 8 we see (for 2013) that the age-identified spending varies over the course of a lifetime. Household incomes reveal that after the “reference individual” turns 44 years of age, spending stagnates and then drops. The general retail sector, where much is spent on ever-changing fashion (clothing and sportswear) for the younger set, faces a difficult future. Many of the shuttered retail shops—catering to a precarious demographic—are not coming back. The big-box retailers (Macy’s, Bloomingdale’s), where the older cohort tends to shop, are also in deep trouble. Older people spend less, and they are dying off.
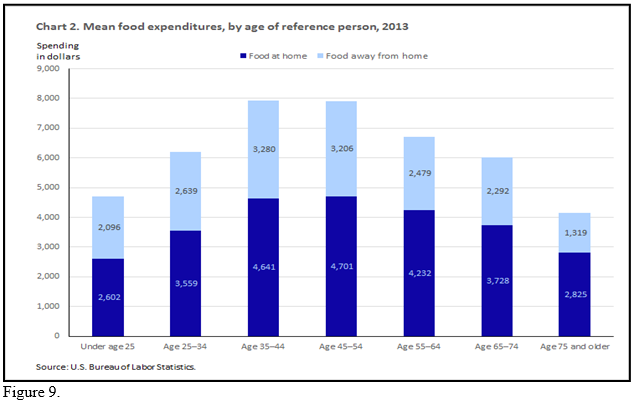
As for the future of restaurants, Figure 9 shows a similar trend for food expenditures, with a particular interest in food away from home. Notice that the restaurant sector is not well served by an aging population. Those of us in Madison know what it is like when the Epic crowd descends on the area’s up-market restaurants around 6:30. With job losses among the younger workers in the service sector, births will disappear as economic uncertainty presses in on them. They will have less money to spend.
In summary, birth rates will now plummet to unheard-of levels. Older workers will find it difficult to re-enter a stressed labor market, and 20-30 year-olds will face a problematic work
prospect the next 5 years. One bright spot seems obvious. With job prospects so grim, many high school graduates will decide that pursuing a college degree seems like a good idea. The opportunity costs are low (no well-paying job to forego), and the post-recovery work place will increasingly be bi-furcated into those with college-based skills and discipline, and the rest. The economic inequality in America may persist.
As an interesting aside, I also notice in the NYT that Uber/Lyft drivers are upset that they cannot get “unemployment” insurance. Sob, sob, sob. Recall how pleased they were to “disrupt” the regular structure of employment (taxi drivers holding actual jobs with taxi companies, or driving their own licensed privately owned cabs)? The average Uber driver worked 10 hours a week, cherry picking and skimming the market during rush hour. Being a disrupter was a badge of honor. Now they wish to be considered “unemployed.” Hmmm.
A number of questions concern the nature of the post-COVID recovery. Obviously there is no prior experience to draw upon. But a few indicators may help us make reasonable inferences in this regard.
I must start with a quite recent experience that—while very different in certain important aspects—is still somewhat helpful. In late 2007 the U.S. started into what is now called the Great Recession. This was not caused by layoffs, closings, and stay-at-home orders. In other words, it had nothing to do, in the beginning, with job losses, closings, etc.
That event was a financial crisis in which banks and other sources of cash (liquidity) suddenly froze up and—if not quickly rectified—threatened to visit serious long-term harm. The banks and large companies were saved by quick action from the government. Even today, there is residual criticism that the large corporations and banks were rescued, but workers were not.
This was a crisis of excessive leverage—debt to assets (or debt to income) was quite high and in such circumstances, the economy is on a “knife’s edge” – the slightest event can trigger fear.
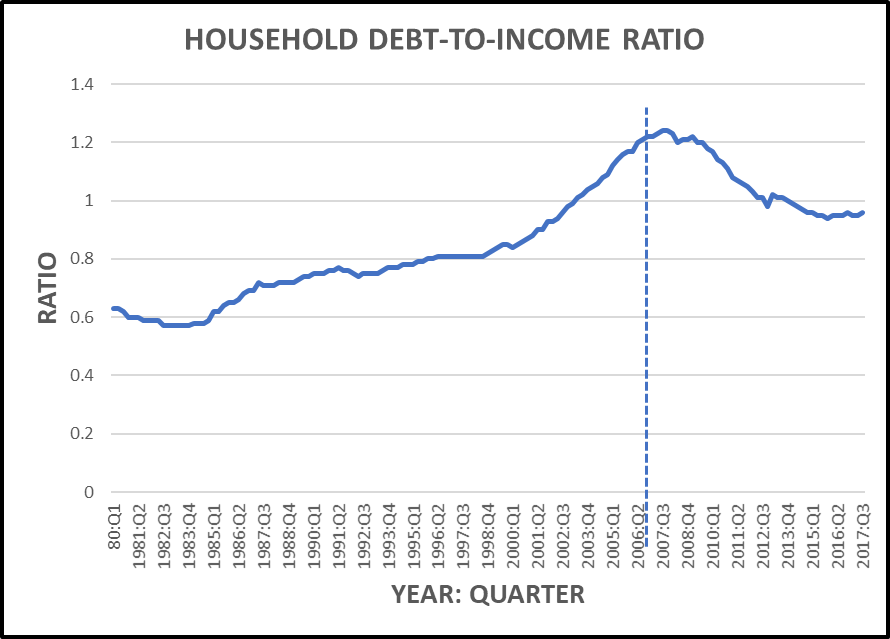
Holders of debt start calling in loans. Figure 1 shows the ratio of debt to income for U.S. households (not businesses) since the first quarter of 1980. This was an era of low interest rates and households were taking on increasing levels of debt. Notice that this ratio had doubled since 1980.
I recall learning, during the latter part of this period, that a favorite activity of school teachers was spending their summers buying, “fixing up” and then selling houses. The term-of-art is “flipping.” Given the salary level of school teachers, I found this to be a surprising past-time. This was an ominous sign that many people missed.
Source: U.S. Federal Reserve Figure 1. Vertical line at start of Great Recession.
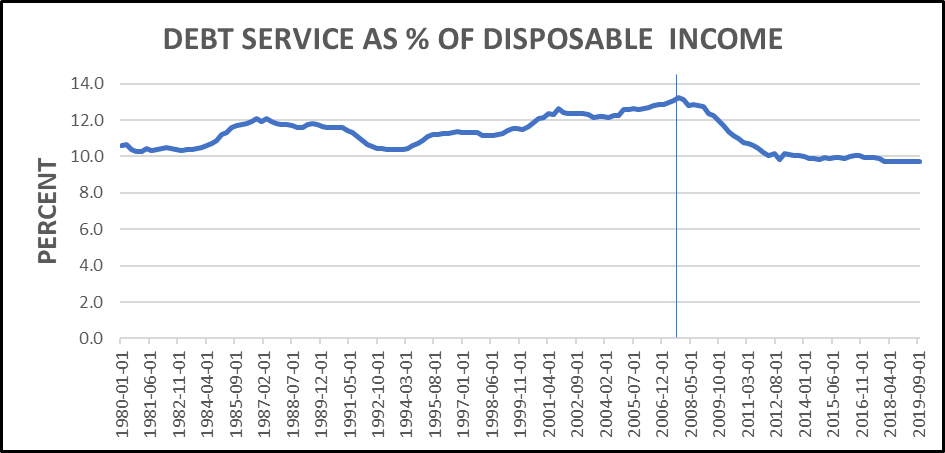
A related event was the expected growth in debt-service obligations as a percent of disposable income (Figure 2). This is NOT debt per se, it is the service costs of holding debt (interest and fees). Since 1980, that had grown from just over 10 percent of disposable income to 13 percent. This is not a large jump, to be sure. But, looked at in another way, debt services costs had grown by about 1/3. Things that look small through one lens, can look large through another.
Source: U.S. Federal Reserve Figure 2. Vertical line at start of Great Recession.
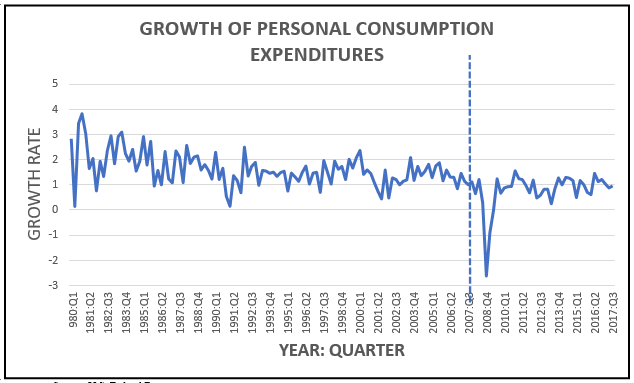
We now come to another interesting series. Household spending accounts for about 2/3 of total GDP (expenditures), so when household spending starts to fall, total economic activity will begin to feel the effects. Figure 3 shows the GROWTH RATE (from year to year) of consumer spending, and since 1980 that rate has been falling. In the early 1980s such spending was growing at about 2% each year. By 1990 it had dropped into the range of 1-1.5 percent growth (year to year). By 2003, we see a rather pronounced decline leading into the Recession that began in late 2007. Now, the increasing burden of debt service might seem to be eating into consumer spending. And recall from Figure 1 that this was a period of pronounced increases in the debt-to-income ratio. Households were taking on greater debt.
Figure 3. Vertical line at start of Great Recession
These trends in debt and consumer spending are instructive as we now turn our attention to the income side of the equation—an issue that now drives the current crisis. This is not a financial crisis driven by excessive leverage and debt service. It is an income crisis driven by job losses and associated disappearance of consumer spending.
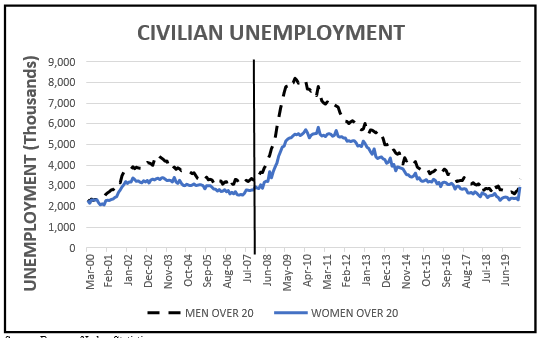
Figure 4 shows civilian unemployment by males and females over the age of 20. Recall that “unemployment” is a reflection of those who are actively seeking work and unable to find it. Discouraged workers (those who have given up) are not counted.
We see that prior to 2007, there had been a reasonable period of falling unemployment— especially among men. But the Great Recession hit men more than it hit women and there is some speculation that this frustration at unwanted idleness among men (often over 50-55) fueled “white anger” leading into the 2016 elections.
The ominous aspect of Figure 4 is not so much in the jump during the Recession (2007-2009). The frightening part is that it took 4-5 years for the level of unemployment to drop back to where it had been prior to the Recession in 2007-2009. At the time of the 2016 election, unemployment was above where it had been in 2003-2004.
Figure 4. Vertical line at start of Great Recession
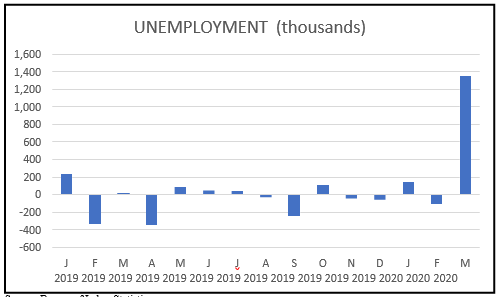
We now come to Figure 5 showing the most recent monthly number of unemployed (in thousands). These are seasonal data so it is in comparison to the corresponding month (year over year). A negative number indicates that there was less unemployment for that month than in the prior year (for that month).
Source: Bureau of Labor Statistics Figure 5.
We must keep in mind that the jump for March 2020 reflects preliminary estimates, and is a serious underestimate since many unemployment claims have not yet been recorded.
The pressing question now is what can we expect in terms of a “rebound” once the pandemic and its associated threats are behind us. Household debt-to-income levels remain high, debt service as a percent of disposable income remains high, and the growth of personal consumption expenditures has remained modest. You may recall the president grousing about low GDP growth—wishing to see it in the range of 2-3 (even 4-5 ) percent. He keeps criticizing the Federal Reserve for not doing enough to increase growth. The level of GDP and its trends have always been reasonable indicators of consumer (voter) satisfaction.
But GDP (and its growth) cannot simply be “willed” up (or down). It is a function of the stock of capital (machines) and workers (employees). And, of the change in output per unit of input of those who work at (or with) those machines—labor productivity.
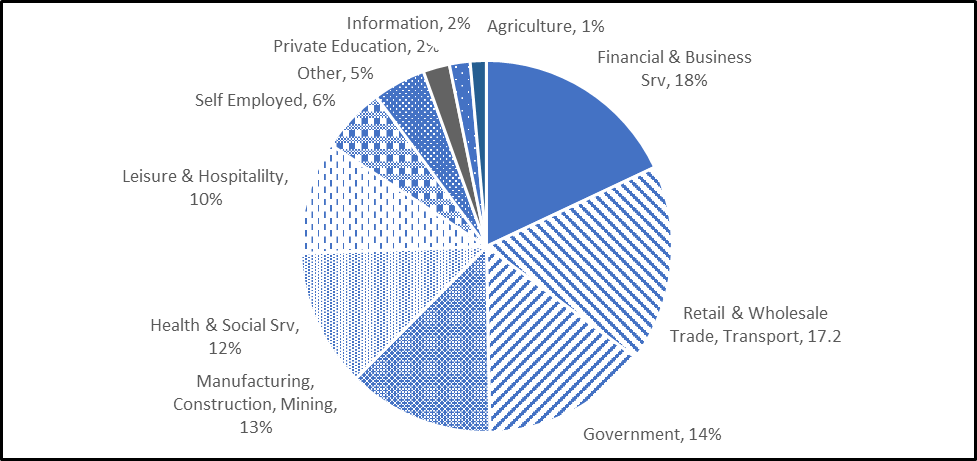
Recall that 80 percent of the American workforce is in the services sector. In Figure 6 I show the sector breakdown of employment for the recent past. We now know that several large aspects of the service sector (retail, leisure/hospitality, trade/transport) are under great duress.
Source: Daniel W. Bromley. POSSESSIVE INDIVIDUALISM: A CRISIS OF CAPITALISM (Oxford University Press, 2019, Figure 4.3) Figure 6. Employment by Sector
When those sectors do begin to recover, there is great uncertainty about the level of employment that might then be on offer. Every business will, I predict, be interested in reducing its reliance on human labor. Many business owners are distressed at the human trauma associated with this crisis, and they certainly feel a serious moral obligation to their workers. Ironically, that personal distress may have the unintended effect, over the long run, of pushing firms in the direction of fewer workers. This will be pronounced in those sectors most vulnerable to economic downturns (restaurants, travel and leisure).
As Amazon and other on-line retailers gain market share against the shrinking “bricks- and-mortar” stores, automation will certainly increase. I predict that the loss of jobs in the service sector will follow and mirror the earlier loss of manufacturing jobs I showed in an earlier post.
To sum up, look again at Figure 4 above, and imagine that long right-hand tail of unemployment climbing once again to a civilian unemployment level of 4,000-5,000 (that is 4-5 million) for the next 5 years.
We might wish to consider the COVID infection rates as a proxy for economic activity across the country. That is, areas that are more connected with the global economy (Seattle, NYC, New Jersey) would be the most exposed to international travel, but also the high density of such
places will tend to increase the ease with which it is spread. These commercial hotspots are the same places where young professionals live and work—compounding the spread.
Below, for the states in the U.S., I show you a graph depicting the percent of COVID-19 infections in each state as a percent of total U.S. infections (as of this morning, April 2), plotted against the Gross Domestic Product (GDP) in each state as a percent of the total U.S. GDP (for the 3rd quarter of 2019).
I have excluded New York and New Jersey because the extraordinary level of population density skews the picture. So we have here 48 states.
The equation in the box simply describes the dotted line (the best fit of the data).
The equation R2 = 0.6373 tells us that the percent of GDP in each state can be thought of as accounting for (but NOT causing) 64 percent of the share of infections in each state.
That is, one might reasonably infer that almost 64 percent of the variation in infections across the
U.S. is associated with the variation in the share of GDP across states. Other things enter the picture—background health status of the population, population density of the state, global-travel for residents of one or more cities in those states, etc.
California is the outlier to the far right (over 16 percent of U.S. GDP, while Texas is the outlier at about 9.9 percent of GDP yet a quite low infection rate—probably attributable to its size and the low density of its population).
Perhaps Grey Eyed Athena has decided it would be quite fitting if the richer places in the country got a little heavier dose of this unwelcome plague. Those who live in the relatively poorer states—generally more rural–might be feeling a little smug right now.
Another fearless prediction—we will see a dramatic drop in births (along with a rise in deaths).
The light-hearted speculation is that all of this tight staying at home will bring a birth boom in December. Do not bet on it. In fact, bet against it.
Times such as this have a profoundly unsettling effect on livelihoods, and this economic uncertainty quickly shows up in fertility decisions.
The U.S. is already close to replacement fertility–this will drop it in a dramatic fashion. Demographic restructuring is now underway.
The issue today is ethical not economic. If the government demands that businesses close, and that “non-essential” people stay isolated, it has deprived them of their livelihood. Urging people to stay home is one thing. Demanding that they stay home is a very different matter.
A libertarian would be shocked by this heavy-handed exercise of authoritarian rule. The Chinese government might be able to do this, but in America?
Are not millions of working people, now deprived of their livelihood, justified in demanding full compensation for their lost incomes?
When government regulations deny an individual the use of her “property” through some regulation, her lost income must be paid to her (fair compensation under the Fifth Amendment to the Constitution).
Wouldn’t a libertarian be angered that the Congress was debating whether or not—and how much—to offer in relief? If the government causes an income loss, of course the government must make those individuals “whole.”
But wait…government “hand-outs”? Libertarians hate that as well. These are vexing times, aren’t they?
One of you asked if this (“relief versus stimulus”) is not a mere “semantic quibble”?
Not at all. Confucius pointed out long ago that “The beginning of wisdom is to call things by their proper name.”
More recently, the philosopher Robert Brandom stated, exquisitely, that “Grasping a concept is mastering the use of a word.”
The concept of a stimulus is, as I pointed out, very different from the concept of relief. They have a different purpose, they are used under different circumstances, and they are expected to have different results.
If the program is called a “stimulus,” and if we think of it as a stimulus, it will be too easy, when this thing is over, for some skeptics to look back and complain that all of that massive spending did not do much stimulating of the economy. They will be correct. That was not its purpose.
Those with a more honest grasp of the situation will ask, instead, “did the program provide relief?” And, of course, the answer will be that, indeed, the program provided a great deal of relief. Was it “enough” relief? We must wait and see.
The media seem confused about what to call the $2.2 trillion legislation coming our way.
We might see it depicted as a “relief” package, and then see that it is a “stimulus” package. Whether or not this new legislation brings necessary relief is yet to be determined. But we must be clear that it is NOT a stimulus package.
A stimulus is required when an economy is suffering from slack and languid aggregate demand. Perhaps consumers are reluctant to spend money because they fear for their job (sound familiar?). Perhaps consumers are trying to pay down some of their credit-card debt and are more discerning about what they think they need. In such cases, the Federal Reserve may take steps to reduce interest rates so that credit—for instance an auto loan—is less burdensome. Banks can be encouraged to reduce lending rates by several steps. These efforts will stimulate spending. If demand for gasoline is suffering a downturn and the oil industry is suffering, the government can purchase crude oil and place it in the Strategic Oil Reserve. The point here is to “prime the pump” so that spending will gradually pick up.
The new legislation is not intended to stimulate aggregate demand since most commercial firms are closed—or on a “war footing.” Here we are trying to mitigate the harmful effects of a severe drop in aggregate demand. And that drop has two sources: (1) millions of individuals have lost their job and are told to stay home; and (2) others, with more stable incomes (retirees, salaried workers with secure earnings), cannot go out and spend as they otherwise might.
As we will now see, the relief will come in several forms: (1) debt forbearance (not forgiveness); (2) income replacement for lost wages (checks in the mail); (3) augmentation of state-run unemployment insurance programs; and (4) some loan-based (not grants) relief for businesses—with conditions attached (no payouts to executives, no stock buy-backs, etc.).
The point is not to stimulate anything—it is to protect people and businesses.
Some may object that this is a mere semantic quibble. I disagree, and so does Confucius.
He said that “The beginning of wisdom is to call things by their proper name.” More recently, the philosopher Robert Brandom stated, exquisitely, that “Grasping a concept is mastering the use of a word.” The concept of a stimulus is, as above, very different from the concept of relief. They have a different purpose, they are used under different circumstances, and they are expected to have different results.
If the program is called a “stimulus,” and if we think of it as a stimulus, it will be too easy, when this thing is over, for some skeptics to look back and complain that all of that massive spending did not do much stimulating of the economy. They will be correct. That was not its purpose.
Those with a more honest grasp of the situation will ask, instead, “did the program provide relief?” And, of course, the answer will be that, indeed, the program provided a great deal of relief. Was it “enough” relief? We must wait and see.