Blog

The Misguided $9 Million Water-Tanker Purchase: A Critical Look at South Sudan’s Misallocation of Resources[1]

Ebony Policy Note 2024-2                                                  13 January 2024

The Misguided $9 Million Water-Tanker Purchase: A Critical Look at South Sudan’s Misallocation of Resources[1]

This Ebony Policy Note is triggered by the initial reactions within the Development Policy Forum (DPF) digital platform (DP) to the decision of the Economic Cluster of the Council of Ministers (CoM) of the Revitalized Transitional Government of National Unity (RTGoNU) of the Republic of South Sudan. Hence, the defining purpose of this Note is to contribute toward enhancing public policy debate in the use of scarce public resources on the one hand and to encourage, on the other, South Sudanese policymakers to pursue evidence-based decision-making processes. The Ebony Policy Note consists of five points: (1) analyzing the cost, (2) exploring alternative solutions, (3) calling for transparency, (4) looking at the economic implications of the decision, and (5) concluding the Note.

1.  Analyzing the Cost: Is $90,000 per Water-Tanker Justifiable?

There are voices within the DPF-DP calling for a cost-benefit approach in debating the decision of the Economic Cluster. In scrutinizing the $90,000 price tag for a water-tanker within Juba City’s borders, a rigorous cost-benefit analysis is imperative to determine whether the expenditure is justifiable. As we dissect this figure, it’s essential to consider the multifaceted nature of the water resources and distribution landscape within the City. Both the public and private sectors play a pivotal role in the provision of water. Yet, the profound question lingers: does the hefty investment yield proportional returns in terms of water supply and reliability? Another question is the appropriateness of the level of government with respect to this particular decision – would it not be appropriate to assign this function to the Government of Juba City? We think this is within the scope of duty of the Mayor of Juba, who has the necessary mandate to go into public-private partnership (PPP) in the provision of basic services, such as water.

When engaging with the private sector, prices might often reflect the operational costs, market conditions, and profit margins deemed acceptable by businesses. However, in the case of the public sector, the concept of opportunity cost becomes quintessentially relevant—public funds allocated for water-tankers are funds diverted from other potentially critical infrastructure or services. Thus, it is not solely the immediate price of the water tankers that must be weighed but also the broader economic impact of such an investment on the City’s financial health and its citizens’ well-being. Here, the answers to the four questions posed by Prof. Dan Bromley are particularly of interest to this discourse.

Moreover, comparing the $90,000 cost against the backdrop of alternative solutions for water delivery and infrastructure development is crucial. Is there evidence to support that this level of spending on water-tankers is the most cost-efficient approach to address Juba City’s water-related challenges? Or could these funds be better leveraged to create more sustainable, long-term water solutions? With judicious analysis, we strive to unravel whether the high price of securing water through these means aligns with the common good and the principles of fiscal federalism underpinned by economic prudence.

2.  Development Priorities: Exploring Alternative Water Supply Solutions

In addressing the growing concern of water scarcity in Juba City, we concur with the legitimate concerns raised in the DPF-DP that it is imperative to orient development priorities toward exploring alternative water supply solutions that meet both the economic and environmental demands of the present and future dwellers of the Juba City. These alternative solutions must be within the overall framework of the Public Financial Management (PFM) system. The FY2023/2024 is now in its third quarter of execution, and one wonders on what basis such a scheme is being undertaken. Is it an item in the supplementary budget that is yet to be presented to the Transitional National Legislature as required by law? Central to this endeavor is the meticulous execution of cost-benefit analysis, which brings to light the long-term sustainability of the proposed purchase of 100 water tankers.

Could this amount of $9.0 million be directed to accelerating the completion of the JICA-funded water project for Juba? The Juba City Council (i.e., government) and NOT the RTGoNU must, in our view, play a pivotal role in this evaluation, bearing in mind the opportunity cost of choosing one investment over another and the overarching need for sustainable water provision for the citizens of Juba City and surrounding counties. The point of departure of the proposed evaluation is the status of the implementation of the ongoing Juba City water project.

Furthermore, we think that the Mayor of Juba City and his government should seek partnership with the Chamber of Commerce in the provision of basic services to all the residents of Juba City. We believe that the private sector’s involvement can yield substantial benefits through the introduction of innovative technologies and efficient water management practices, ultimately influencing the price and affordability of water for the populace. Effective collaboration between the City Council and private entities can harness their respective strengths, minimize weaknesses, and drive the development of water infrastructure that is both cost-effective and reliable. As such, meticulous planning and strategic allocation of resources in Juba City are vital to ensure that the economic and social dividends of alternative water supply solutions can be realized, providing a cornerstone for both present and future generations to thrive.

3.  Government Transparency and Decision-Making: Who Pulled the Strings?

In Juba City, the complexities of governance – RTGoNU, Central Equatoria State Government (CESG) – and the interplay between the public and private sectors are manifested in the critical issue of water resource management. As policymakers grapple with the allocation of this vital resource, the principles of fiscal federalism, cost-benefit analysis, and opportunity cost come to the fore, shaping decisions that carry widespread socioeconomic implications. The question of water pricing, in particular, underscores the tension between ensuring affordability for the populace and covering the expenses associated with purification, distribution, and infrastructure maintenance. We are aware of the fact that this is an election year, and the government is anxious to show some tangible results of its service delivery. Nevertheless, it is an entity like the Juba City Council that could expedite the implementation of basic services, such as water for Juba inhabitants.

Compounding this dilemma is the demand for government transparency, as stakeholders from both the public and private sectors and the general citizenry seek to understand the rationale behind the decision-making process. The private sector’s involvement often sparks concerns over profit motives potentially overshadowing the public interest, while the public sector is tasked with balancing fiscal responsibility with equitable service provision. The scrutiny of who exactly ‘pulled the strings’ in these decisions is pivotal, not only to foster trust through transparency but also to ensure that the long-term welfare of Juba City’s inhabitants and the stewardship of its resources are not compromised for short-term gains. In this regard, we think that the Economic Cluster of RTGoNU must take its hands off this water-tankers purchase scheme and allow the Government of Juba City Council to pull the strings.

4.  Economic Implications: The Long-term Costs of a Short-sighted Investment

The pursuit of short-sighted investments without meticulous cost-benefit analysis can lead to dire economic implications, particularly when essential resources like water are involved. In South Sudan, the allure of swift monetary gains has occasionally prompted both private and public sector entities to overlook the long-term costs associated with such investments. It is imperative to understand that the price of immediate benefits can be outweighed by the eventual financial burdens that arise when the full spectrum of opportunity costs is not considered. What became the dura saga, crisis management saga, Letters of Credit (LCs) saga, and so on were noble ideas necessitated by the urgency of the moment and the propensity for swift monetary gains by influential individuals without political morality. Based on our bitter lessons of experience, this water-tankers purchase scheme should not be allowed this time.

For instance, if the focus on rapid infrastructure development compromises the sustainable management of water resources, the City could face future shortages that would not only elevate water prices but also impose hefty costs on future industries and residential areas alike. Subsequently, these higher operational costs would trickle down to consumers, exacerbating socioeconomic disparities. Therefore, strategic investment decisions must embody the division of responsibilities between the RTGoNU, CESG, and Juba City Council Government. It must also focus on a holistic viewpoint, incorporating environmental sustainability and long-term resource availability. When the private sector and the public sector (consensus within the three levels of government) align on such principles, the collective objective of fostering resilient and prosperous economic growth for Juba City materializes, mitigating the risks of incurring prohibitive long-term costs for seemingly lucrative, but ultimately unsustainable, short-term gains.

5.  The Uncompromising Role of the DPF-DP

In concluding this Ebony Policy Note, it is reassuring to see the quick response from the DPFers to what we have called the misguided $9.0 million water-tanker purchase scheme. From the heart of Juba City, where water scarcity underscores everyday life’s struggles, the DPFers are raising their voices in opposition to the Economic Cluster’s fiscal priorities. They are calling for a careful cost-benefit analysis approach. This call is on the argument that this scheme falls within the mandate of the Juba City Council. Moreover, even if it were to be within the mandate of RTGoNU, the call would still stand in that public funds are being committed outside the PFM underpinning the approved FY2023/2024 budget and diverted away from crucial infrastructure improvements, particularly in the water sector, where the price of inaction is measured in human lives.

We, therefore, appeal to the Economic Cluster of RTGoNU to take note that the opportunity cost of not respecting the PFM procedures and our decentralization/federalism system is too high, especially when considering the responsibility and mandate of the Juba City Council as well as the potential role of the private sector to drive economic growth and improve living standards. The DPFers are particularly criticizing the Economic Cluster’s allocation of resources, challenging the justifications for outlays that do not directly confront the pressing needs of Juba’s inhabitants. By emphasizing a data-driven approach, these critics strive to shift the focus of government spending toward projects that promise tangible benefits for the populace. Their concern reflects a broader debate on national expenditure, demanding accountability and transparency in pursuing policies that should serve the public interest and well-being.


[1] Prepared by VEST, Ebony Center

Ebony blog 2024-3

Harnessing Artificial Intelligence to Accelerate Literacy in South Sudan

This blog is supplementary to our Ebony blog 2024-2 on “Investing in Education: The Key to Economic Growth in South Sudan.” The country has been fraught with challenges since its inception. Education, particularly literacy, remains a keystone in rebuilding and stabilizing the country. Artificial Intelligence (AI) offers a beacon of hope in this daunting endeavor by providing scalable and innovative solutions to overcome educational hurdles. This blog outlines the ways AI can be utilized to enhance and accelerate literacy across South Sudan.

AI-Driven Educational Platforms

Digital educational platforms powered by AI can deliver personalized learning experiences, catering to the unique needs of each student. These platforms can, lack of electricity notwithstanding, provide literacy programs in local languages, adjusting to the learner’s pace and augmenting areas that require additional attention.

Voice Recognition and Translation Tools

Given South Sudan’s linguistic diversity, AI-enabled voice recognition and translation tools could break language barriers. These tools can aid in the development of literacy by translating educational materials and high-quality content into multiple indigenous languages, making learning more accessible and efficient. This would, in turn, accelerate the adoption of mobile money and its wider usage in the economy of South Sudan, thereby contributing toward national financial inclusion.

Mobile Learning Applications

With the rise of mobile phone usage in South Sudan, AI-infused mobile applications can serve as a valuable resource for learners who do not have access to formal education. AI can track user progress, recommend tailored educational content, and adaptively reinforce learning outcomes. However, limited access to electricity remains one of the major constraints to the usage of this new technology. Nevertheless, South Sudan cannot afford to be left behind. It must allocate some of the oil for roads resources to the mobile learning infrastructure.  

Data Analytics for Tailored Education Policies

AI’s ability to process vast volumes of data can help South Sudan’s educational authorities analyze literacy rates, identify trends, and unveil the impact of interventions. With these insights, policymakers can make data-driven decisions to enhance the effectiveness of literacy programs.

Interactive Chatbots and Virtual Tutors

AI-driven chatbots and virtual tutors can engage students in interactive learning dialogues and provide instant feedback. They can answer questions, assist with language construction, and guide users through complex topics, ensuring literacy development continues outside of traditional classroom settings.

Overcoming the Digital Divide

To harness AI effectively, it is essential to address the emerging digital divide between rural and urban centers in South Sudan. Investing in rural electrification through solar and/or wind-powered power generation would lead to expanding internet access, and ensuring the availability of user-friendly devices is a preliminary step that will allow the full integration of AI into educational strategies.

Collaborative Partnerships

Cross-sectoral partnerships between the government, mobile telephone operating and mobile money companies, NGOs, South Sudanese diaspora, and local communities are critical in deploying AI solutions. These collaborations can tailor AI tools to meet South Sudan’s literacy needs and ensure that technology aligns with cultural and societal contexts. Melinda and Bill Gates Foundation is currently supporting m-Gurusg in the application of digital financial services (DFS) in South Sudan. This collaboration can be extended to boost literacy in the country.

Ethical Considerations

As AI is adopted to boost literacy, ethical considerations must guide the development and deployment of this technology. Privacy, data security, and inclusion should be at the forefront, ensuring that the benefits of AI are equitably distributed among all South Sudanese. Many South Sudanese, including the least literate, are using Facebook and TikTok at an alarming rate. This calls for urgent action before it is too late to restrain the use of these tools for unethical purposes.

Conclusion

Literacy is the cornerstone of personal empowerment and societal development. In South Sudan, the innovative use of AI can create substantial gains in literacy rates. With thoughtful implementation, fostering partnerships, and a commitment to ethical principles, AI technology could dramatically transform the educational landscape, driving South Sudan toward a more literate and prosperous future.

Ebony blog 2024-2                                             

Investing in Education: The Key to Economic Growth in South Sudan

Investing in education is the cornerstone to building a prosperous future for South Sudan, the youngest nation in the world. Despite being blessed with natural resources, years of conflict and political instability have thwarted its economic growth. South Sudanese must invest in education and create a skilled workforce to catalyze its economy.

Education is a fundamental human right and a potent tool for economic development. It has the potential to lift individuals out of poverty and transform economies. Education creates a skilled workforce that can contribute to economic growth and innovation. It also provides the knowledge and skills that enable individuals to make informed decisions about their lives and participate in the democratic process.

South Sudan has one of the lowest literacy rates globally, with only 34% of adults able to read and write. The country is also grappling with a shortage of trained teachers, with only one teacher for every 100 students. The solution? South Sudan must invest in teacher training, curriculum development, and infrastructure, especially broadband internet, to improve its education system. Schools in remote areas can be supported through investment in solar and/or wind-powered rural electricity, which would, in turn, facilitate distance learning.

One way of investing in technology for education is through partnerships with international organizations and NGOs. These organizations can provide funding and technical support to enhance the country’s education quality. They can also train teachers and develop curriculum materials that are relevant to the local context.

Investing in education will not only benefit individuals but also the economy as a whole. A skilled workforce will attract foreign investment and bolster South Sudan’s competitiveness in the global market. It will also create opportunities for entrepreneurship and innovation, which are crucial for economic growth.

Undoubtedly, South Sudan faces significant challenges in investing in education, given its history of conflict and lack of infrastructure. However, partnerships with international organizations and NGOs can help to overcome these challenges and lead to a brighter future for the country.

In conclusion, investing in education is pivotal to the economic growth and prosperity of South Sudan. It will create a skilled workforce that can drive economic development and innovation while empowering individuals to make informed decisions about their lives and participate in the democratic process.

Ebony Blog 2024-1

From Conflict to Prosperity: How Economic Policy Can Help Rebuild South Sudan

Let us make 2024 the year when we fully implement our vision of the war of liberation. This vision was articulated in 2004 by the Sudan People’s Liberation Movement (SPLM) blueprint – The SPLM Framework for War-to-Peace Transition. But we must first acknowledge that the civil war (2013 -2020) in South Sudan has caused immense damage to the country’s economy, infrastructure, and political stability. The war has left thousands of people dead, displaced millions, and shattered the country’s economic potential. However, with the genuine implementation of the peace agreement and adopting the right economic policies, South Sudan can rebuild its economy and achieve prosperity. In this regard, here are five right economic policies that we think South Sudan can adopt to rebuild its economy and achieve prosperity:


a) Improve the agriculture sector by investing in infrastructure, irrigation systems, and modern farming techniques to improve productivity and increase output;

b) Attract foreign direct investment (FDI) by improving the legal and regulatory framework, reducing corruption, and ensuring the security of investments;

c) Encourage entrepreneurship and small and medium-sized enterprises (SMEs) by providing financial support and training and creating a business-friendly environment;

d) Focus on infrastructure development by investing in roads, railways, river transport, and airports to improve connectivity and provide an enabling environment for businesses; and

e) Implement policies that promote political stability, good governance, and peace, which would, in turn, create a conducive environment for economic growth and development.


1. Improve the agriculture sector: Agriculture is the backbone of South Sudan’s economy and provides employment to more than 70% of the population. However, the sector has been severely impacted by the civil war. The government must invest in infrastructure, irrigation systems, and modern farming techniques to revive the agriculture sector to improve productivity and increase output. This will help the farmers create jobs and sustainable livelihoods in the rural areas and ensure food security for the entire country.


2. Attract foreign direct investment (FDI): South Sudan has immense natural resources, including oil, minerals, and timber. The government needs to create a conducive environment for foreign investors by improving the legal and regulatory framework, reducing corruption, and ensuring the security of investments. This will create job opportunities for ordinary South Sudanese citizens and boost economic growth.


3. Encourage entrepreneurship and small and medium-sized enterprises (SMEs): SMEs are the backbone of any developing economy, and South Sudan is no exception. The government can encourage entrepreneurship and build a thriving private sector to generate employment and contribute to economic growth by providing financial support and training and creating a business-friendly environment.


4. Focus on infrastructure development: The country has an inadequate network of roads, railways, river transport, and airports, which hinders trade and investment. Hence, the government needs to invest in infrastructure development to improve connectivity and provide an enabling environment for businesses. This will improve the movement of goods and services through a robust supply chain pulled, especially by the infrastructure sector’s operational construction and transportation sub-sectors.


5. Implement policies that promote political stability, good governance, and peace: Political stability, good governance, and peace are critical for economic growth and development. This is because businesses require a stable political environment in order to play a crucial role in the economic growth and development of a country. The government must, therefore, create a conducive environment for businesses by implementing policies that promote political stability, good governance, and peace. This will not only attract foreign investors but will also encourage local investors to invest in the country. 


In conclusion, South Sudan could rebuild its economy and achieve prosperity. The government must focus on improving agriculture, attracting foreign direct investment, promoting entrepreneurship, and investing in infrastructure development. By implementing the right economic policies, South Sudan can overcome the challenges of the civil war, achieve sustainable economic growth, and embark on the path to poverty eradication.


Trajectory of COVID-19

It has been two weeks since we looked at the trajectory of COVID-19. Here are a few new indicators. Figure 1 shows the number of cases per million residents, by state. Our neighbors in Minnesota are enjoying their “geographic distancing” from Chicago. But there is something else at work. Perhaps it is Scandinavian abstinence.

Figure 2 shows the change in the number of cases since April 2. Rhode Island and Delaware are understandable—proximity to New York and New Jersey. But remote and de-populated South Dakota? We now know that the governor of that lovely land figured she knew better than the medical experts and fake media. As we say where I grew up out west, “If you f…with the bull you get the horn.” Someone from South Dakota ought to understand a little cowboy wisdom. But partisanship still reigns.

Now I revisit a graph I sent on April 2, 2016 relating the share of total cases with the share of GDP (3rd quarter of 2019). Recall that this excludes New York and New Jersey—obvious outliers. The two extremes are California (top right) and Texas (below the curve in the middle).

And here are the same data for April 16, 2020. Notice that my little model now accounts for a slightly smaller share of the variation in cases in relation to share of GDP (R2=0.5938 versus 0.6373). This is expected as the virus spreads out away from the origins (economic and travel nodes). As the situation evolves other factors are assuming greater salience—elderly populations, general health conditions, absence of strict social distancing (South Dakota).

Dr. Daniel Bromley can be contact at dbromley@wisc.edu.

Spending Trajectory

Friends,

Here is a compilation of credit card expenditures covering the three-month period January 1 – April 1, 2019 with the same period in 2020. We can see where the hurt is (and isn’t). Negative is to the left.

Some of the categories do not map directly into specific places of business—this is how credit card companies classify spending. We can see how spending has contracted into a few “essential” categories. One can also predict which expenditure categories may face the most difficult recovery.

Dr. Daniel Bromley can be contact at dbromley@wisc.edu.

WHAT’S IN A NAME? RECESSION OR DEPRESSION

A recession is two consecutive quarters in which GDP falls. We are certainly headed for a recession. Some estimates are that GDP will not recover to its January 2020 level for a year or more. Will we have a depression? Unlikely. Words matter—and in economics, words are concepts. And as a famous philosopher reminds us, “Grasping a concept is mastering the use of a word.”

The term “depression” comes from a period in which prices are depressed—the general price level is falling or has fallen. Here is a picture of consumer prices from January 1929. Prices did not fully recover until World War II. But you cannot have a depression without depressed (falling) prices.

Are we facing a period of falling prices? Except for gasoline prices—the result of a Saudi- Russian game—few prices will be falling.

Ironically, the closure of so many businesses rules out falling prices. After all, prices fall when merchants have too many goods on hand and they wish to sell those goods to a population with too little income but an enduring demand for goods and services. Prices are reduced to encourage buying.

Unfortunately, once prices start to drop in this way, consumers hold off—expecting that prices might actually fall a little more tomorrow. This cycle continues as consumers delay, merchants panic, prices are reduced (sales, special offers,), etc. etc. Necessities are purchased, but many other purchases are delayed. Falling sales and revenues to merchants then induce them to reduce staffing, causing unemployment and further reducing aggregate income—and further feeding price cuts to encourage consumption. The economy falls into an under-consumption trap. Japan spent a decade or more in such a place during the 1990s and even into the recent past. It was a period of stagnation.

But the stay-at-home nature of this crisis has squashed demand for everything but bare subsistence—including toilet paper. Just think how much toilet paper is now sitting in the storage closets and back rooms of schools, restaurants, factories, movie theaters, and retail stores throughout the land. On the last day of work, the owners/managers of these shuttered places would have done all of us a big favor by sending each furloughed/dismissed employee home with a large bundle of toilet paper. But I digress.

To understand why we will not encounter a Depression, let me point out how very different this time is from the 1930s.

The period following World War I was one of exuberance and excess. Rural out-migration, fueled by technical change in agriculture spurred industrialization and optimism. The sense was that the stock market would go on rising forever. Sound familiar?

Agricultural production was robust leading to a drop in farm prices—creating rural despair.

In March of 1929 the Federal Reserve expressed alarm of excessive speculation in the stock market. Jitters produced some selling. Steel production started to decline as war-time levels of output began to fall. Construction slowed down a little, and car sales began to fall, furthering the decline in demand for steel (that is before cars were made of plastic).

But bank credit was easy and consumer debt seemed to be edging up. The stock market had been on a nine-year run that saw the Dow Jones Industrial Average increase in value tenfold. Sound familiar yet? There was a small correction in late September. The London Stock Exchange fell somewhat in September—and there was fraud involved. On October 24—so-called “Black Thursday”—the U.S. Stock market lost 11 percent of its value at the opening bell on very heavy trading.

This shock fueled fear of running out of cash and so many people rushed to their bank to withdraw funds. Recall, that was a cash economy—there were no credit cards. Most families held all of their liquidity in banks (or under the mattress). Some big-ticket merchandise was purchased on “lay-away.” The second phase, was therefore, a “run on banks” to get cash. By 1933, over 10,000 banks (almost one-half of the total) had failed. The supply of money had fallen by over 30 percent.

The third phase was evident—as purchases fell off, prices fell, and banks failed, many businesses were cut off from usual sources of credit. Unemployment grew. By 1933, almost forty percent of non-farm workers had lost their job. Farms and other businesses fell into bankruptcy. The recovery was sporadic and uncertain.

The fourth phase introduced something that is now familiar—a natural disaster. Widespread drought struck the major agricultural region of the country (the Midwest) in 1934—crops failed, more farms fell into bankruptcy, and food lines emerged. We did not have the storage capacity of today and so grain reserves were minimal. There were no global food chains bringing tomatoes, bananas, citrus, fish, and other exotics to the household. People ate meat and potatoes (recall dinner when you were growing up?).

The drought continued until 1940. The Dust Bowl further destroyed agriculture in the Midwest. Vast migration to California ensued. But economic conditions there were not much better. Even in those days, approximately 12-14 percent of the population lived on farms so they had access to some food. Even the non-farm population was still linked to the farm of parents or grandparents. Today, less than 1 percent of the population is on farms.

The memory of the Depression is one of unemployment, bankruptcies, and food lines. We did not have the policy instruments available to push money out to distressed families facing unemployment. So the Works Progress Administration put people to work.

It is from that experience that government programs were created to alleviate a repeat. The Federal Deposit Insurance Corporation assures us that our bank deposits are safe. Many other policy instruments are now available. However, we are learning just how clunky and slow they can be. One of the perils of a federal system, with strong independent states, is that we have 50 different political entities groping their way through this mess. Given sharp political divides, it is no surprise that responses vary. Apparently, states are forced to bid against each other to obtain essential medical supplies and equipment. European countries look upon us in disbelief.

So, we will not have a Depression, but we will now enter, I predict, a long period of suppressed economic activity. The definition of essential and frivolous consumption is up for debate.

Ostentation seems sure to go out of fashion. As I said earlier, Grey Eyed Athena is apparently repulsed by many of our lifestyle habits and choices.

I believe we might be entering a period defined as the “Great Suppression.” How does that sound?

Dr. Daniel Bromley can be contact at dbromley@wisc.edu.

What Recovery? What Baby Boom?

This morning’s New York Times contains an article by Alan Yuhas entitled “Don’t Expect a Quarantine Baby Boom.” Recall an early “Fearless Prediction” of mine to that effect. This phenomenon requires a little more elaboration. And that relates to the nature of the so-called “recovery.”

There is speculation whether the “recovery” from the current situation will look like a “V” or a “U” or even the Nike “swoosh” for a little extra pizazz. All of this alphabet (and logo) talk pertains to GDP—the only metric that many people wish to consider. Sadly, this is to grab the “wrong end of the stick.” It is the wrong end because GDP is a complex mix of many variables that are themselves quite obscure—perhaps unknowable.

Among the considerations that must figure into all of this speculation, consider just a few: (1) the unknown changes in population over the near future; (2) the unknown impact on closures and bankruptcies of millions of businesses; (3) the unknown effect of changes in the labor force (the number of people working or actively looking for work); (4) the unknown labor force participation rate (the share of the work force actually working); (5) the unknown level of prices by which the total physical output of goods and services is actually valued for measurement as GDP; and (6) an unknown return wave of infections that will scramble all of the above.

It is better to start with the several components of a complex factor—only then can we meaningfully approach the aggregate of all of the disparate constituents. To gain traction on this problem, we must start with the realization that the U.S. has been experiencing, over the past decade or so, many symptoms of what I will call “late (or mature) capitalism.” What are these traits?

First, we want to look at the rate of population growth. Consider Figure 1.

Even before the Great Recession of 2007-2009, the annual rate of population growth had been on a profound decline. This is to be expected. All societies, as they become richer, show declining rates of population growth. This holds throughout the poorer countries of the world, and it happens in those that are already “rich.” In fact, if we take a historic look at this issue, high birth rates have been a practical social response to poor medical care (high infant mortality) and the lack of an old-age pension system beyond the family. In early times, there were good reasons to have many births since 60%-75% of infants would die. It was economically necessary to produce male offspring because of cultural practices in which girls married “out” of the household, while males stayed close and continued the family line (and business—usually farming).

With a drop in infant mortality, the need for redundant births disappeared. With the spread of organized (publicly funded) old-age protection, the private (family-based) burden of caring for parents gradually gave way. Two strong reasons for high fertility evaporated. Birth rates fell.

Childbirth was once the major cause of female mortality. Much family discord arises over raising children—it is difficult. With approximately 60% of women now in the workforce, and with husbands still resistant to sharing “housework”, families have more income but less patience with the demands of children. Parents increasingly wish to invest more in their children, so it is important to have fewer claimants on limited investment funds. So-called “helicoptering” of children is easier with fewer children to attend to. We see that smaller families are both the result of these changes in economic and social conditions, and the cause of such behaviors we observe. As societies become wealthier—ignoring for the moment the severe inequalities in America and a few other places—birth rates (family size) will fall.

Richer countries also have improved health care, which drives down death rates. We get what is called the “demographic transition—moving from high birth and death rates, through falling deaths because of improved health care, but continuing high births rates from cultural inertia (see above) and finally falling birth rates. The developed world is firmly in Phase III with negative rates of population growth. (Figure 2).

Being a rich country is a symptom of “mature capitalism” –we have “arrived.” It is in the success of the system—making us richer—that we find the seeds of an eventual decline in its ability to do what we want from it. After all, with fewer births, there are fewer energetic youngsters to enter the work force and keep it vibrant and dynamic. The system’s success is the source of its gradual stagnation (Figure 3).

That is why we now see—in Figure 4—low rates of growth in GDP (when compared to the “go- go” post-war years of the 1960s and 1970s). In an analogue of our own human life cycle, aging is a plausible reason to slow down a little. A mature capitalist economy loses its vigor.

Much of the growth of the American economy throughout our history has been the arrival of immigrants. After all, since around 1600, virtually everyone who became an American had arrived in a ship or came north out of “new Spain.” In the period after World War II, immigrants continued to fuel our economic growth. They did the hard and dirty (and impecunious) work that others, newly rich, no longer wished to be bothered with. Immigrants will always drive economic growth—they are eager or they would not have come here, they are relatively poor and dislike their poverty, and they are willing to do most anything to put bread on the table.

In Figure 5 we see an ominous sign for the growth of the U.S. economy. Specifically, immigrants are not replacing the decline in indigenous (“natural”) births. With the current politically inspired hostility toward immigrants, we now face the worst of both worlds—declining “native” birth rates, and disappearing immigrants. Who will do the work?

Now to births. Recall I earlier predicted a quite dramatic drop in births following this health and economic crisis. Consider just such drop in both Figure 1 and Figure 5. Those earlier birth rates are not coming back.

It is also well known that the American population is aging (Figure 6). Aside from the obvious implications for the labor force, there is the challenge of funding the Social Security (and health systems) with a declining share of the population actually working.

Finally, and returning to the nature of the active workforce, a maturing society and economy also shows signs of less mobility. It was once said that the typical American family moved every five years—and those moves were driven by job mobility, new opportunities, etc. But look at Figure 7. Since 1991, the rate of geographic mobility is now almost one-half of what it had been. There are fewer young people to move about, and older folks prefer to stay where they are. When companies close, or lay off employees, those who are somewhat settled, with a family, or who are close to retirement age, will remain in place. That too is a result of our relative wealth and comfort.

These demographic signs must be seen as playing a profound role in the post-COVID economy.

Consider spending by age group. In Figure 8 we see (for 2013) that the age-identified spending varies over the course of a lifetime. Household incomes reveal that after the “reference individual” turns 44 years of age, spending stagnates and then drops. The general retail sector, where much is spent on ever-changing fashion (clothing and sportswear) for the younger set, faces a difficult future. Many of the shuttered retail shops—catering to a precarious demographic—are not coming back. The big-box retailers (Macy’s, Bloomingdale’s), where the older cohort tends to shop, are also in deep trouble. Older people spend less, and they are dying off.

As for the future of restaurants, Figure 9 shows a similar trend for food expenditures, with a particular interest in food away from home. Notice that the restaurant sector is not well served by an aging population. Those of us in Madison know what it is like when the Epic crowd descends on the area’s up-market restaurants around 6:30. With job losses among the younger workers in the service sector, births will disappear as economic uncertainty presses in on them. They will have less money to spend.

In summary, birth rates will now plummet to unheard-of levels. Older workers will find it difficult to re-enter a stressed labor market, and 20-30 year-olds will face a problematic work

prospect the next 5 years. One bright spot seems obvious. With job prospects so grim, many high school graduates will decide that pursuing a college degree seems like a good idea. The opportunity costs are low (no well-paying job to forego), and the post-recovery work place will increasingly be bi-furcated into those with college-based skills and discipline, and the rest. The economic inequality in America may persist.

As an interesting aside, I also notice in the NYT that Uber/Lyft drivers are upset that they cannot get “unemployment” insurance. Sob, sob, sob. Recall how pleased they were to “disrupt” the regular structure of employment (taxi drivers holding actual jobs with taxi companies, or driving their own licensed privately owned cabs)? The average Uber driver worked 10 hours a week, cherry picking and skimming the market during rush hour. Being a disrupter was a badge of honor. Now they wish to be considered “unemployed.” Hmmm.

Dr. Daniel Bromley can be contact at dbromley@wisc.edu.

COVID RECOVERY

A number of questions concern the nature of the post-COVID recovery. Obviously there is no prior experience to draw upon. But a few indicators may help us make reasonable inferences in this regard.

I must start with a quite recent experience that—while very different in certain important aspects—is still somewhat helpful. In late 2007 the U.S. started into what is now called the Great Recession. This was not caused by layoffs, closings, and stay-at-home orders. In other words, it had nothing to do, in the beginning, with job losses, closings, etc.

That event was a financial crisis in which banks and other sources of cash (liquidity) suddenly froze up and—if not quickly rectified—threatened to visit serious long-term harm. The banks and large companies were saved by quick action from the government. Even today, there is residual criticism that the large corporations and banks were rescued, but workers were not.

This was a crisis of excessive leverage—debt to assets (or debt to income) was quite high and in such circumstances, the economy is on a “knife’s edge” – the slightest event can trigger fear.

Holders of debt start calling in loans. Figure 1 shows the ratio of debt to income for U.S. households (not businesses) since the first quarter of 1980. This was an era of low interest rates and households were taking on increasing levels of debt. Notice that this ratio had doubled since 1980.

I recall learning, during the latter part of this period, that a favorite activity of school teachers was spending their summers buying, “fixing up” and then selling houses. The term-of-art is “flipping.” Given the salary level of school teachers, I found this to be a surprising past-time. This was an ominous sign that many people missed.

Source: U.S. Federal Reserve
Figure 1. Vertical line at start of Great Recession.

A related event was the expected growth in debt-service obligations as a percent of disposable income (Figure 2). This is NOT debt per se, it is the service costs of holding debt (interest and fees). Since 1980, that had grown from just over 10 percent of disposable income to 13 percent. This is not a large jump, to be sure. But, looked at in another way, debt services costs had grown by about 1/3. Things that look small through one lens, can look large through another.

Source: U.S. Federal Reserve
Figure 2. Vertical line at start of Great Recession.

We now come to another interesting series. Household spending accounts for about 2/3 of total GDP (expenditures), so when household spending starts to fall, total economic activity will begin to feel the effects. Figure 3 shows the GROWTH RATE (from year to year) of consumer spending, and since 1980 that rate has been falling. In the early 1980s such spending was growing at about 2% each year. By 1990 it had dropped into the range of 1-1.5 percent growth (year to year). By 2003, we see a rather pronounced decline leading into the Recession that began in late 2007. Now, the increasing burden of debt service might seem to be eating into consumer spending. And recall from Figure 1 that this was a period of pronounced increases in the debt-to-income ratio. Households were taking on greater debt.

Figure 3. Vertical line at start of Great Recession

These trends in debt and consumer spending are instructive as we now turn our attention to the income side of the equation—an issue that now drives the current crisis. This is not a financial crisis driven by excessive leverage and debt service. It is an income crisis driven by job losses and associated disappearance of consumer spending.

Figure 4 shows civilian unemployment by males and females over the age of 20. Recall that “unemployment” is a reflection of those who are actively seeking work and unable to find it. Discouraged workers (those who have given up) are not counted.

We see that prior to 2007, there had been a reasonable period of falling unemployment— especially among men. But the Great Recession hit men more than it hit women and there is some speculation that this frustration at unwanted idleness among men (often over 50-55) fueled “white anger” leading into the 2016 elections.

The ominous aspect of Figure 4 is not so much in the jump during the Recession (2007-2009). The frightening part is that it took 4-5 years for the level of unemployment to drop back to where it had been prior to the Recession in 2007-2009. At the time of the 2016 election, unemployment was above where it had been in 2003-2004.

Figure 4. Vertical line at start of Great Recession

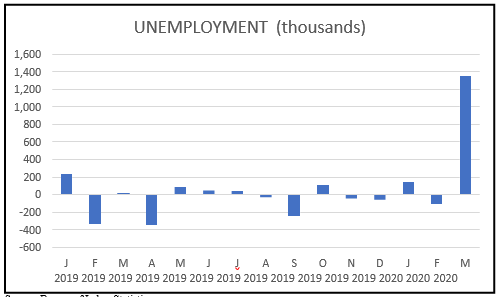
We now come to Figure 5 showing the most recent monthly number of unemployed (in thousands). These are seasonal data so it is in comparison to the corresponding month (year over year). A negative number indicates that there was less unemployment for that month than in the prior year (for that month).

Source: Bureau of Labor Statistics
Figure 5.

We must keep in mind that the jump for March 2020 reflects preliminary estimates, and is a serious underestimate since many unemployment claims have not yet been recorded.

The pressing question now is what can we expect in terms of a “rebound” once the pandemic and its associated threats are behind us. Household debt-to-income levels remain high, debt service as a percent of disposable income remains high, and the growth of personal consumption expenditures has remained modest. You may recall the president grousing about low GDP growth—wishing to see it in the range of 2-3 (even 4-5 ) percent. He keeps criticizing the Federal Reserve for not doing enough to increase growth. The level of GDP and its trends have always been reasonable indicators of consumer (voter) satisfaction.

But GDP (and its growth) cannot simply be “willed” up (or down). It is a function of the stock of capital (machines) and workers (employees). And, of the change in output per unit of input of those who work at (or with) those machines—labor productivity.

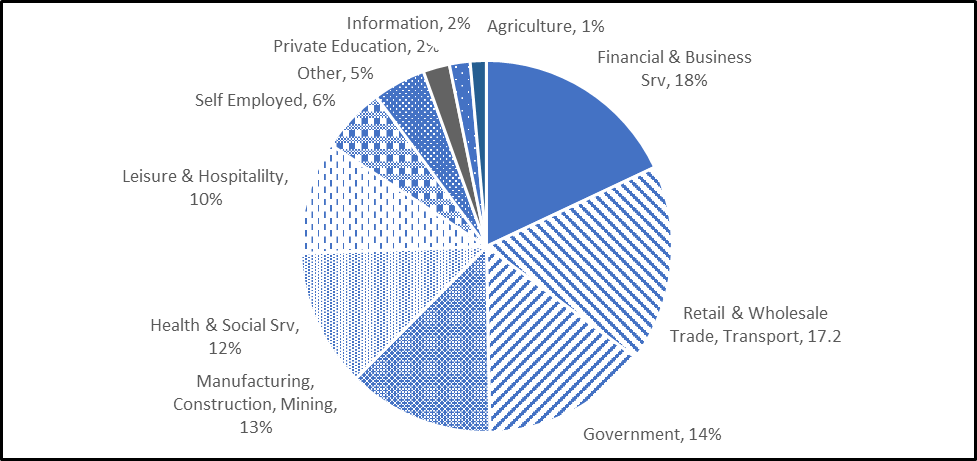
Recall that 80 percent of the American workforce is in the services sector. In Figure 6 I show the sector breakdown of employment for the recent past. We now know that several large aspects of the service sector (retail, leisure/hospitality, trade/transport) are under great duress.

Source: Daniel W. Bromley. POSSESSIVE INDIVIDUALISM: A CRISIS OF CAPITALISM (Oxford University Press, 2019, Figure 4.3)
Figure 6. Employment by Sector

When those sectors do begin to recover, there is great uncertainty about the level of employment that might then be on offer. Every business will, I predict, be interested in reducing its reliance on human labor. Many business owners are distressed at the human trauma associated with this crisis, and they certainly feel a serious moral obligation to their workers. Ironically, that personal distress may have the unintended effect, over the long run, of pushing firms in the direction of fewer workers. This will be pronounced in those sectors most vulnerable to economic downturns (restaurants, travel and leisure).

As Amazon and other on-line retailers gain market share against the shrinking “bricks- and-mortar” stores, automation will certainly increase. I predict that the loss of jobs in the service sector will follow and mirror the earlier loss of manufacturing jobs I showed in an earlier post.

To sum up, look again at Figure 4 above, and imagine that long right-hand tail of unemployment climbing once again to a civilian unemployment level of 4,000-5,000 (that is 4-5 million) for the next 5 years.

I could be wrong—though it is unlikely 😊

Dr. Daniel Bromley can be contact at dbromley@wisc.edu.

COVID-19 AND INCOME

We might wish to consider the COVID infection rates as a proxy for economic activity across the country. That is, areas that are more connected with the global economy (Seattle, NYC, New Jersey) would be the most exposed to international travel, but also the high density of such

places will tend to increase the ease with which it is spread. These commercial hotspots are the same places where young professionals live and work—compounding the spread.

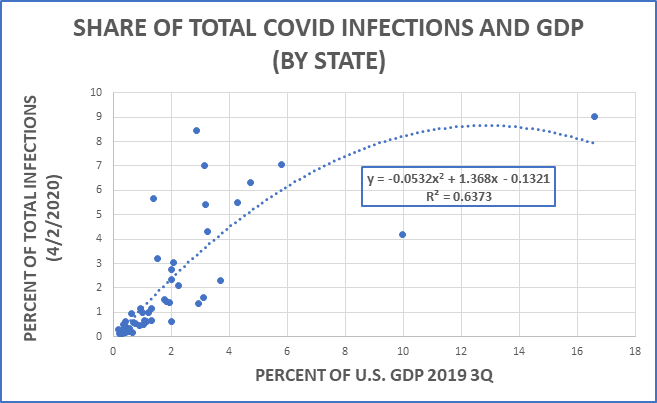
Below, for the states in the U.S., I show you a graph depicting the percent of COVID-19 infections in each state as a percent of total U.S. infections (as of this morning, April 2), plotted against the Gross Domestic Product (GDP) in each state as a percent of the total U.S. GDP (for the 3rd quarter of 2019).

I have excluded New York and New Jersey because the extraordinary level of population density skews the picture. So we have here 48 states.

The equation in the box simply describes the dotted line (the best fit of the data).

The equation R2 = 0.6373 tells us that the percent of GDP in each state can be thought of as accounting for (but NOT causing) 64 percent of the share of infections in each state.

That is, one might reasonably infer that almost 64 percent of the variation in infections across the

U.S. is associated with the variation in the share of GDP across states. Other things enter the picture—background health status of the population, population density of the state, global-travel for residents of one or more cities in those states, etc.

California is the outlier to the far right (over 16 percent of U.S. GDP, while Texas is the outlier at about 9.9 percent of GDP yet a quite low infection rate—probably attributable to its size and the low density of its population).

Perhaps Grey Eyed Athena has decided it would be quite fitting if the richer places in the country got a little heavier dose of this unwelcome plague. Those who live in the relatively poorer states—generally more rural–might be feeling a little smug right now.

Dr. Daniel Bromley can be contact at dbromley@wisc.edu.